SINGAPORE – Emplifi, the leading unified customer experience platform, today released the results of its comprehensive analysis of Q4 2021 social media data, offering key insights into paid and organic user engagement and post interaction on Instagram and Facebook, and social media customer care.
Ad spend on Facebook and Instagram in Asia Pacific (APAC) increased 24% in Q4 2021, in comparison to the previous quarter. Year-over-year (YoY) growth rose 11% to USD 2,793.12 per ad account per month. In Singapore, social ad spend surged 32% in Q4 in comparison to the previous quarter. YoY growth jumped 16% to USD 2,801.39 per ad account per month.
In Q4 2021, global ad spend was higher than at any point over the past year. Compared to the previous quarter, ad spend increased by 25% than what was spent in Q3 2021. A healthy holiday season led paid social to soar in Q4, up 21.25% from the same time last year. This also highlights how much more brands invest in paid social over the holiday season. During the last quarter of 2021, global Click-Thru-Rates (CTRs) held steady but Cost-Per-Click (CPC) increased, meaning marketers had to pay more for that audience. In APAC, CPC grew 34% YOY while in Singapore, CPC grew 20% YoY.

Brands seeking to benchmark their social media content’s level of engagement – as measured in likes, comments, and shares – will be interested in Emplifi’s analysis across more than 7,000 brands. In general, Instagram posts earned higher engagement than Facebook posts. In Q4 2021, APAC brands earned approximately 17 interactions per 1,000 impressions for a Facebook post, a 26% decrease compared to Q4 2020. Meanwhile, Instagram posts received about 65 interactions per 1,000 impressions in Q4 2021, a 35% decline compared to last year. On Facebook and Instagram, E-commerce brands had the highest engagement at 50% and 49% of interactions respectively. On Facebook, FMCG food lagged behind (2.9%) while on Instagram, Retail Food (3.2%) had the lowest engagement rates.
On the organic side, Facebook Instream Live Videos by brands in APAC generated the highest engagement with fans and followers compared to other types of posts, with 39 median post interactions. For Instagram, Carousel and Instagram TV performed well, with 76 and 62 median post interactions respectively.
“It’s important that brands understand what consumers want and need at each stage of their purchase journey. The foundation of any successful social media campaign is content that truly resonates with your target audiences, which alongside customer care, is a large contributor to a positive customer experience” said Emplifi CMO Zarnaz Arlia.
Social Media Customer Care
Social media efforts related to customer service are a very recent shift. Gone are the days when consumers interact with brands by just phone or email. Today’s consumers spend their time on social media – that’s where they want to engage with brands and they have high expectations on responsiveness. Based on Forrester Analytics Consumer Technographics Benchmark Survey, 2021, about 67% of APAC consumers use social media as a tool to show brands how they feel about them.
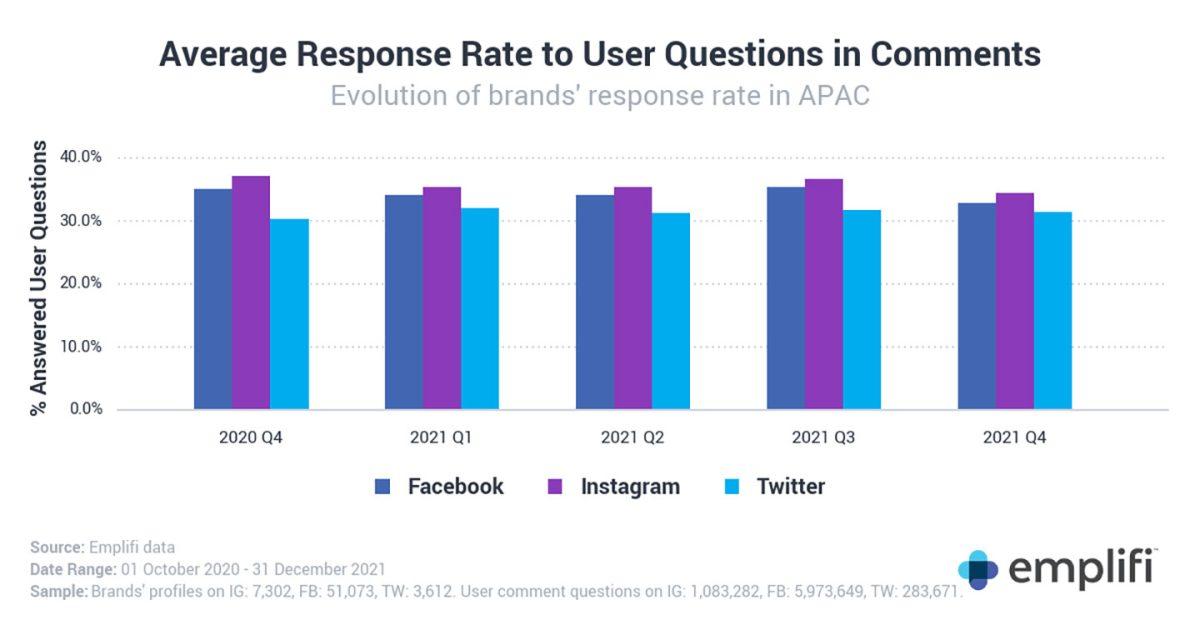
Emplifi also analyzed the efficacy of social media customer care by measuring how often brands respond to user questions in the comments (response rate), and the timeliness of their response (response time).
Within the APAC region, brand response rate declined slightly in Q4 2021 compared to Q4 2020 across two platforms – Facebook (-6.45%) and Instagram (-7.48%). On the other hand, Twitter’s response rate grew +3.27% YoY. Global data indicates that Beauty and FMCG Food brands have the highest response rates to user questions on social media, while Automotive brands had the lower response rates.
In terms of timeliness, APAC brands are taking longer to reply to user questions in comments on Instagram and Twitter, with year-on-year increases of 1.36 hours and 0.7 hours seen on these platforms, respectively. On the other hand, brands’ response times on Facebook decreased by just under an hour since Q4 2020. The growing mainstream use of chatbots is also noteworthy. Over time, expect brands to increase both response rate and response time by leveraging AI- powered chatbots to respond to frequently asked questions.
“Consumers expect fast answers to their questions and we see that there is room for improvement when it comes to brands’ response time on social media. By leveraging technology to handle simpler inquiries, brands can free up their agents to focus on more complex requests, ensuring that they meet customer expectations time and time again. The businesses that will succeed and gain market share, are the ones that understand just how big the impact of customer experience is today,” said Arlia.
Emplifi’s Report Methodology:
- Emplifi’s analysis is based on Q4 2021 data and year-on-year comparisons downloaded at the beginning of January 2022. You can read the findings here.
- Asia Pacific countries included in the report: American Samoa, Bangladesh, Bhutan, Brunei, Cambodia, China, Christmas Island, Cocos Islands, Cook Islands, East Timor, Fiji, Hong Kong, India, Indonesia, Kiribati, Laos, Macao, Malaysia, Maldives, Marshall Islands, Micronesia, Mongolia, Myanmar, Nauru, Nepal, Niue, Norfolk Island, North Korea, Northern Mariana Islands, Palau, Papua New Guinea, Philippines, Pitcairn, Samoa, Singapore, Solomon, South Korea, Sri Lanka, Taiwan, Thailand, Tokelau, Tonga, Tuvalu, Vanuatu, Vietnam, Wallis and Futuna.


